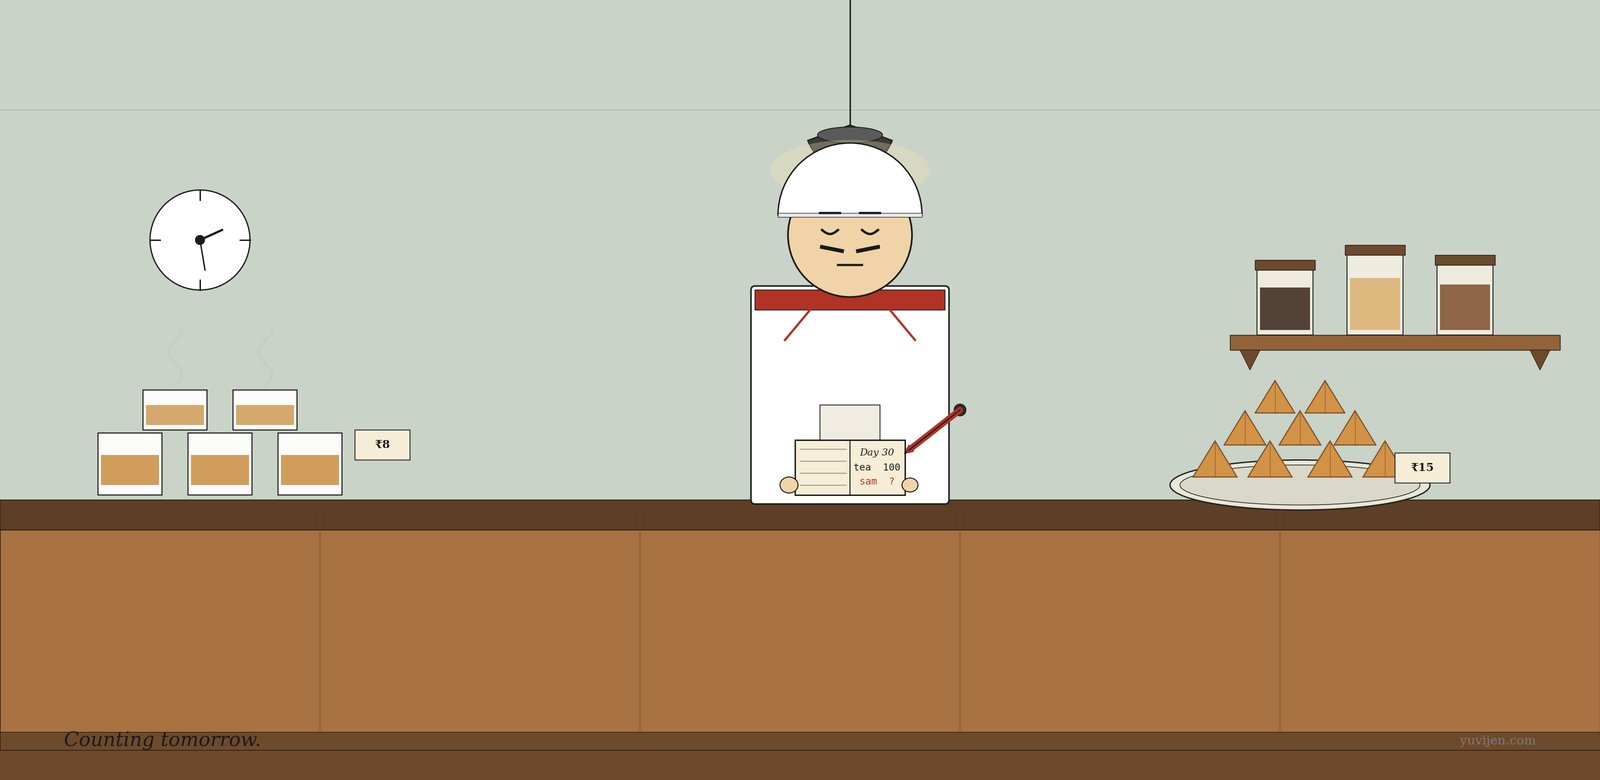
The next afternoon. Same tea stall. Same kettle. Same ceiling fan turning slowly above. Vijay has reopened his notebook on the counter, but the columns are different now. Today’s columns: tea cups sold and samosas sold, side by side, 30 days deep.
His problem this time is more practical. Last week he ran out of samosas at 4 p.m. The week before, he had a dozen left over by morning, hard as little stones. He wants to fry the right number tomorrow. Not too many. Not too few. He wants to plan.
Correlation is back, on her usual bench, holding a glass of tea. She looks rested. (Her cousin had not, this morning, called with a new theory.) Vijay pushes the new notebook across to her.
Vijay says, “Look — same idea, different question. When I sell more tea, I sell more samosas. I can see it. Can you give me a number for tomorrow?”
Correlation tries first
Correlation pulls the notebook close, runs through her calculation, and after a few minutes writes:
“0.88.”
Vijay leans in and asks, “0.88. That is… good?”
She smiles and says, “Tight relationship. When the tea cups go up, the samosas go up too. Almost in lockstep.”
Vijay nods, then asks the actual question. “So if tomorrow I expect 100 tea cups, how many samosas should I fry?”
Correlation pauses. She sips her tea. She sets it down carefully.
She says, “I… I cannot quite answer that one.”
Vijay frowns and asks, “Yesterday you told me everything. Today you cannot tell me 65 versus 70 samosas?”
She says, “I describe. I do not predict. I can tell you they move together. I cannot tell you by how many samosas per tea cup. The number you want is someone else’s job.”
There is a small silence. The kettle hisses. The fan ticks.
Regression walks in
The awning rustles. A tall man steps in under the awning in a starched off-white clerk’s coat, glasses sliding down his nose, with a small leather notebook in one hand and a long wooden ruler tucked under his other arm. He nods at Correlation.
She nods back and says, “You came.”
He says, “I always come.”
He sets the ruler down on the counter — clack — and orders one tea. No sugar. He pulls out a small pencil and waits.
Vijay says, “And you are?”
Correlation says, “Vijay, this is Regression. He picks a side, fits a line, and gives you a number for tomorrow.”
Regression tries
Regression pulls the notebook over, opens it carefully, and goes silent for a minute. He measures something with his ruler — though no one is sure exactly what. He writes neatly in the margin. He underlines once. Then he turns the page around so Vijay can see it.
He has written:
“ŷ = 5 + 0.6 x”
Vijay squints and says, “That looks more like algebra than samosas.”
Regression says, “It is both. The x is your number of tea cups for the day. The y-hat is the predicted number of samosas. Plug x in. You get y-hat out. So: tomorrow you expect 100 tea cups. Multiply by 0.6, add 5. 65 samosas.”
Vijay writes 65 in the margin of the notebook.
Regression continues. “Two pieces of meaning hidden inside this small line. The 0.6 is the slope — for every extra tea cup you sell, expect about 0.6 extra samosas. The 5 is the intercept — even on a day you sold zero tea cups, my line predicts five samosas, just because there is some baseline of samosa-eating customers who never order tea.”
Vijay sits down on his own counter and says, “So Correlation said they move together. And you said for every cup of tea, fry about 0.6 more samosas. Same notebook, two different sentences.”
Regression nods and says, “She describes. I plan.”
Correlation looks at Vijay and adds, “In the business books, this gives both of us proper names. I describe what is already there in your data — so they call me descriptive analytics.”
Regression says, “And I predict what is coming next from that same data — so they call me predictive analytics. Same family. Different floor of the same office.”
The plot twist — the symmetry trap
Vijay, encouraged, asks a follow-up. “Now flip it for me. If I sold 100 samosas, how many tea cups did I sell?”
Regression looks up sharply and says, “That is a different question. Different equation. Different line.”
Vijay blinks and asks, “Different line? Same notebook!”
Regression sighs the patient sigh of a man who has explained this many times. He says, “Correlation does not care about direction — r between tea and samosas equals r between samosas and tea. My lines are not so polite. The line I fit when tea is the input is not the same line you get if you flip them. If I treat samosas as the input, I get a different slope and a different intercept. The two lines only agree if the relationship is perfect — and real data is never that polite.”
Correlation pats Regression’s shoulder and says, “He gets a little serious about this. But he is right. Always know which variable you are predicting from, and which you are predicting to. Swap them, and your line changes.”
The same chat, in a chart
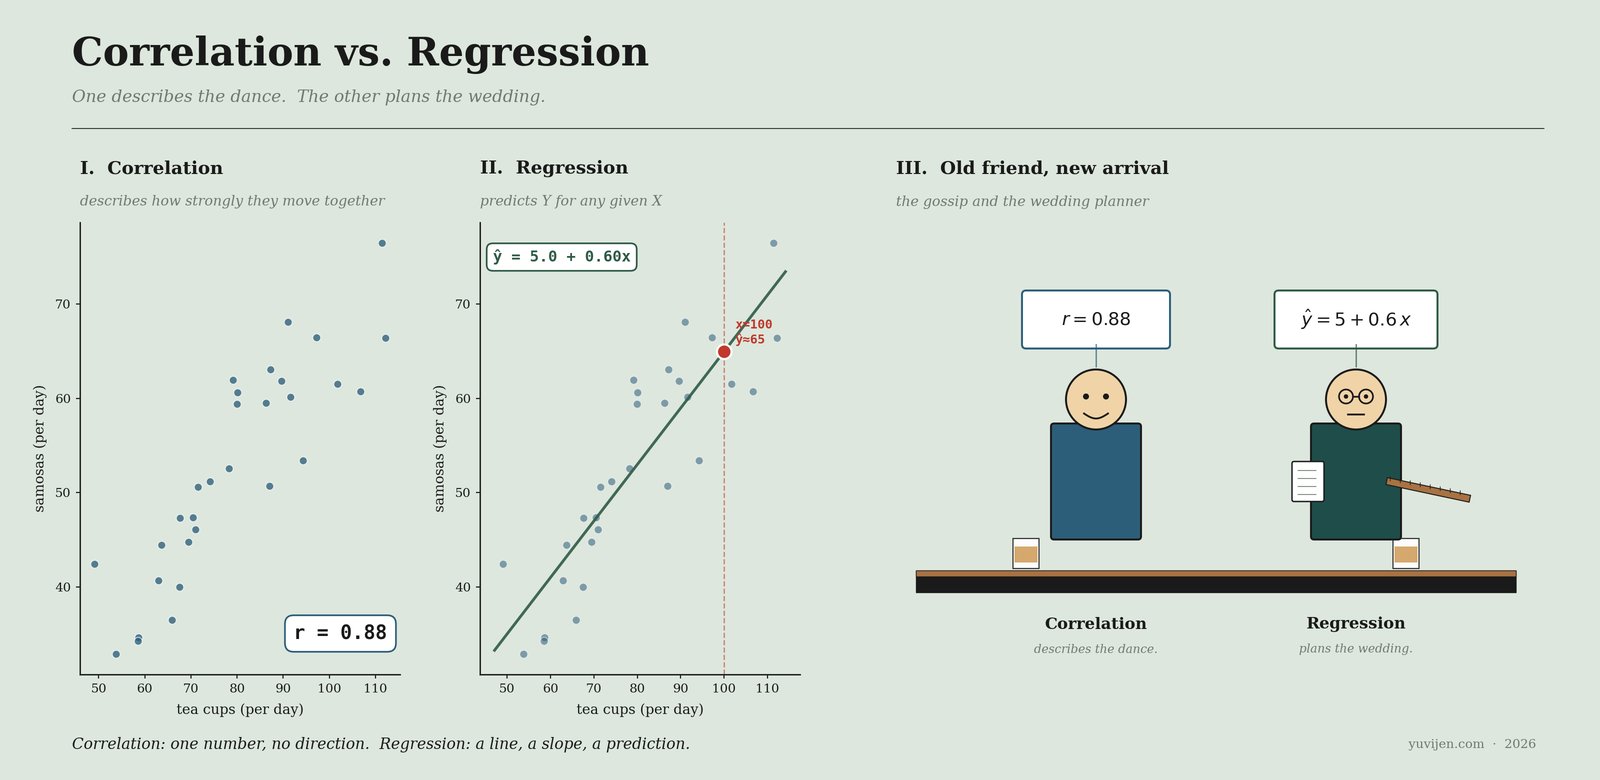
Same data both times. The first panel summarises the friendship in a single number — r = 0.88. The second panel turns the same data into an equation and points at a future Tuesday — 65 samosas. Same notebook. Two different jobs.
One warning before he leaves
Regression closes the notebook and stands up. He says, “One last thing, Vijay. My line works inside the range of data you have. If tomorrow you somehow sell 1,000 tea cups, do not multiply 1,000 by 0.6 and fry 605 samosas. I have not seen anything that large. Outside the data, my line is guessing — sometimes badly, sometimes hilariously. Stay inside the range, and we are friends.”
Vijay nods slowly and says, “Predict, but only inside what I have seen.”
Regression says, “Inside the range. Always.”
Quick gut-check
Same tea-cups-and-samosas notebook, but today you measure samosas in half-portions, so every count doubles. What happens to r? What happens to the slope?
r does not change at all. It is unitless — same number whatever ruler you use. The slope, however, doubles. It now reads 1.2 half-portions per tea cup. Same friendship. Different ruler on Y.
The bill
Vijay closed the notebook with both numbers written inside. 0.88 at the top of one page. 65 at the top of the next. Tomorrow he would fry the second number. The day after, he would update the line. Maybe Friday it would be 66.
The fan ticked. The kettle hissed. Correlation finished her tea. Regression pocketed his pencil and tucked the ruler back under his arm. Vijay started prepping samosas.
Use them together. Correlation tells you whether there is a relationship worth predicting. Regression tells you what number to put in your notebook for tomorrow. One describes. The other plans. Neither of them, for the record, has ever met Vijay’s cousin.
For the math-curious
r = Cov(X, Y) ÷ (σ_X · σ_Y)
ŷ = β₀ + β₁ x , with β₁ = r × (σ_Y / σ_X)
Same family. Different jobs.