All posts

Tag

#fundamentals

17 posts tagged with “fundamentals”.

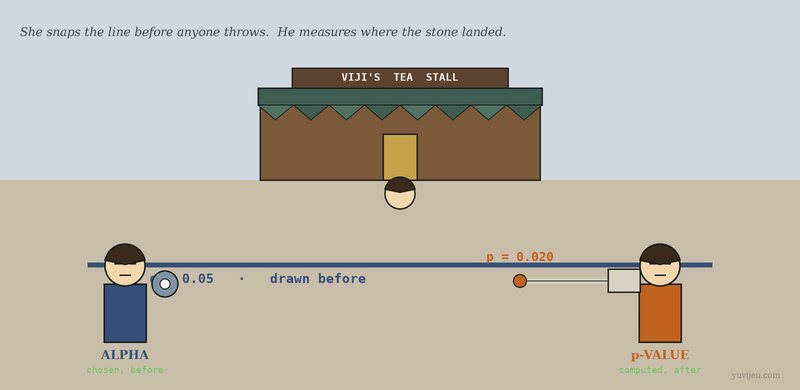
Stylised illustration of the road outside a tea stall. A woman in slate blue kneels and snaps a chalk line across the ground before anything is thrown, her reel still in hand. A man in burnt orange stands further along with a measuring tape, waiting to measure where a stone has landed. Viji watches from behind his counter. The chalk line is labelled α = 0.05 and drawn before; the tape is labelled p = 0.020 and measured after.

Analytics

p-value and Alpha Walk Into a Tea Stall

Viji's new kettle looks like it sold 8 more cups a day, and the test returns p = 0.020. His cousin asks what would have happened if he had wanted α = 0.01 instead. Two strangers explain why that question has to be answered before the data arrives, not after.
Vijayakumar P 11 min read
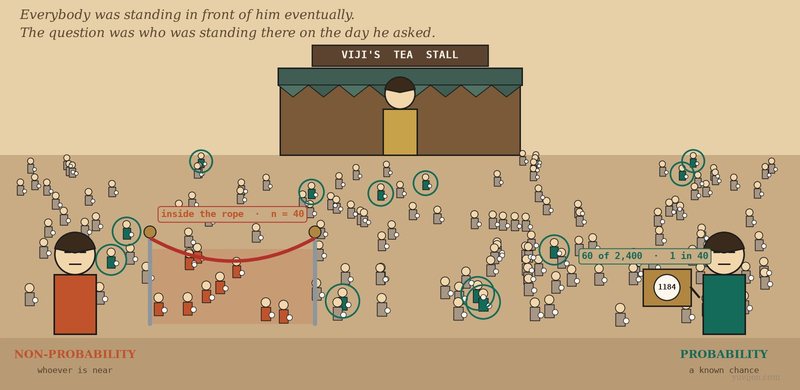
Stylised illustration of a busy tea stall in daylight, a crowd of many small customer figures spread across the frame, each wearing a small numbered token. On the left a man in burnt orange has set down two brass posts with a rope cordon looped around the handful of people nearest the counter, and holds a clipboard. On the right a woman in deep teal turns a brass lottery drum, and scattered evenly across the whole crowd, far beyond the rope, a dozen figures are ringed in teal to show who was drawn. Viji stands behind the counter between them.

Research

Probability and Non-probability Sampling Walk Into a Tea Stall

Viji asked the 40 people standing in front of him and got a clear answer: bun-butter. Then somebody drew 60 numbered tokens out of a drum and the answer changed completely. Two strangers explain why one of those samples has a margin of error and the other one cannot have one.
Vijayakumar P 13 min read
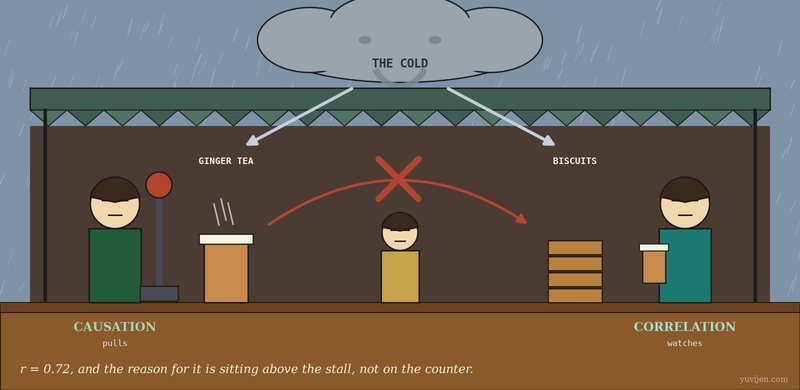
Stylised illustration seen from outside the tea stall on a rainy day, grey-blue sky and slanting rain. Under the awning Viji stands behind his counter between a glass of ginger tea and a stack of biscuit packets. On the left a man in dark green holds a large lever with a red handle. On the right a woman in teal stands calmly holding a single glass of tea. Above the stall a large grey cloud with a faint face has two arrows coming down from it, one pointing at the ginger tea and one at the biscuits, while a third arrow drawn between the tea and the biscuits is crossed out.

Analytics

Correlation and Causation Walk Into a Tea Stall

Ginger tea and biscuits rise and fall together, r = 0.72, and Viji is about to discount ginger tea to sell more biscuits. Correlation is back, a man with a lever walks in behind her, and the person who explains everything has been sitting in the corner the whole time.
Vijayakumar P 11 min read
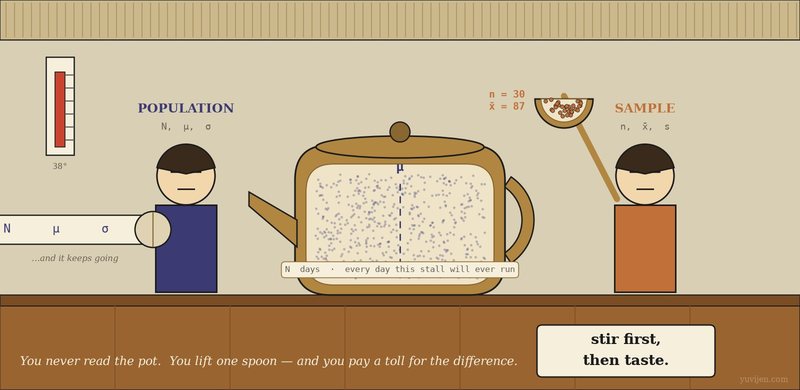
Stylised illustration of a tea stall, camera close on the counter. A large brass pot dominates the centre, drawn as a cut-away so hundreds of tiny indigo dots are visible inside it with a dashed line marked mu running down the middle and a label reading N days, every day this stall will ever run. On the left a woman in deep indigo stands beside a long paper scroll that unrolls off the left edge of the frame, the visible portion printed with N, mu and sigma, captioned and it keeps going. On the right a man in burnt amber holds a long brass ladle raised clear of the pot, its bowl holding a small spoonful of amber dots labelled n = 30, x-bar = 87. A card propped on the counter reads stir first, then taste. A wall thermometer on the far left reads 38 degrees.

Analytics

Population and Sample Walk Into a Tea Stall

Viji's notebook says the average is 87 customers a day. His cousin says that is the average of his notebook, not of his stall. Two strangers — one with a scroll that never fully unrolls, one with a brass ladle — explain the difference, and what it costs.
Vijayakumar P 11 min read
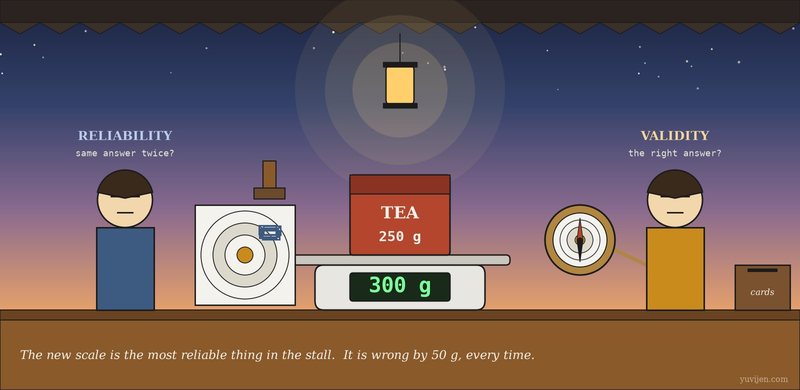
Stylised illustration of a tea stall at dusk, deep blue sky and a hanging lantern glowing above the counter. At the centre of the counter sits a large kitchen scale holding a tea packet labelled 250 g, its display reading 300 g. On the left a woman in slate blue holds a rubber stamp over a sheet showing five identical stamped marks in a tight cluster, all off to one side of a printed target. On the right a man in saffron holds up a brass compass, its needle pointing at the target's centre. A wooden feedback box with a slot sits at the counter's edge.

Research

Reliability and Validity Walk Into a Tea Stall

Viji's new kitchen scale gives the same reading every single time, and it is wrong every single time. His customer-satisfaction card has the same problem. Two strangers, one with a rubber stamp and one with a brass compass, explain why consistent is not the same as correct.
Vijayakumar P 11 min read
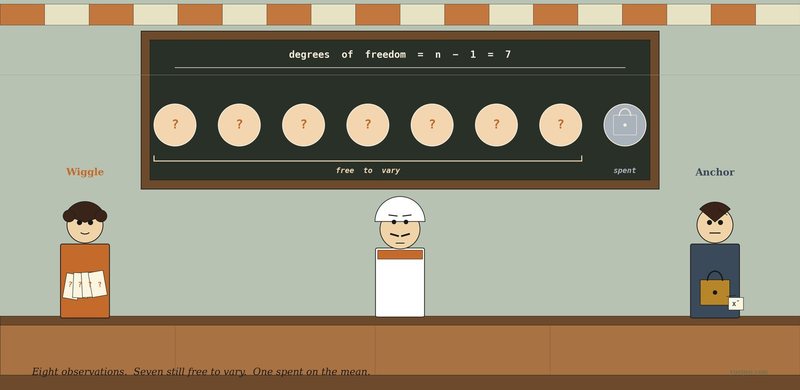
Stylised illustration of a tea stall — Viji stands centre behind his counter looking up at a long chalked diagram on the back wall titled `degrees of freedom = n − 1 = 7`. Eight large round tokens are chalked in a row: seven of them have a `?` inside (free), the eighth has a small chalked padlock (spent). A brace under the seven free tokens reads `free to vary`; the eighth is labelled `spent`. On the far left a woman in warm orange holds a fan of blank slips each marked with a `?`. On the far right a man in graphite-blue holds a brass padlock with a small paper tag reading `x̄`.

Analytics

Degrees of Freedom Walks Into a Tea Stall

Viji's calculator keeps using n − 1 instead of n. He doesn't know why. Two strangers — one with a fan of blank slips, one with a brass padlock — explain why every parameter you estimate costs you one of your data points.
Vijayakumar P 11 min read
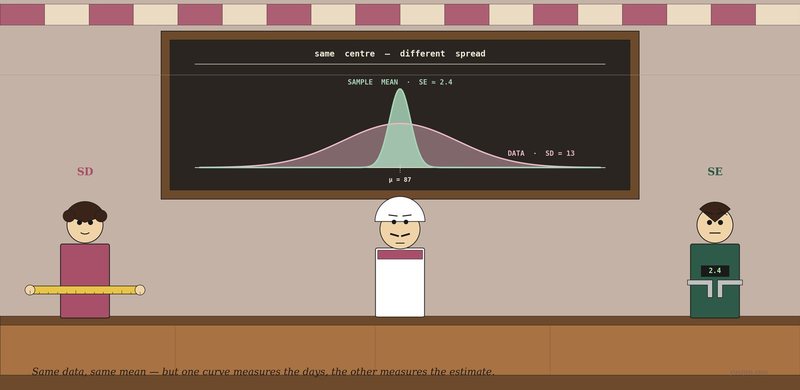
Stylised illustration of a tea stall — Viji stands centre behind his counter looking up at a chalkboard showing two overlaid bell curves at the same centre (μ = 87). A wide low pink curve labelled `DATA · SD = 13` and a narrow tall green curve labelled `SAMPLE MEAN · SE ≈ 2.4` sit at the same centre, title chalked above reading `same centre — different spread`. On the far left a woman in cranberry holds a long yellow measuring tape stretched between her hands. On the far right a man in forest green holds a precision caliper with a digital readout showing 2.4.

Analytics

Standard Deviation and Standard Error Walk Into a Tea Stall

Viji's cousin asks how confident he is about the 87-customer average. Viji says "SD = 13". The cousin says "wrong number, brother." Two strangers — one with a measuring tape, one with a precision caliper — explain why.
Vijayakumar P 11 min read
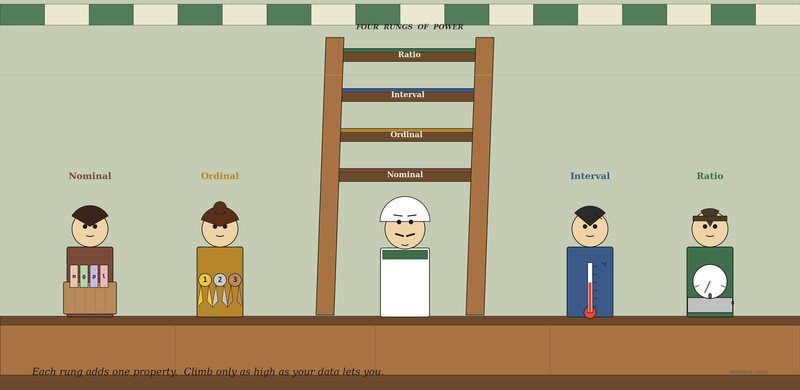
Stylised illustration of a tea stall — Viji stands centre behind his counter, looking up at a four-rung wooden ladder leaning against the back wall. Each rung is capped in a different colour and chalked with a level name (bottom-up: Nominal in earthy brown, Ordinal in gold, Interval in blue, Ratio in green). On the far left a sibling in earthy brown holds up a basket of name-cards labelled m / g / p / l. To the inner left a sibling in gold holds three rosette ribbons numbered 1, 2, 3. To the inner right a sibling in blue holds a small red-bulb thermometer marked °C. On the far right a sibling in green holds a kitchen scale with a 0 prominent on its dial.

Analytics

Nominal, Ordinal, Interval, Ratio Walk Into a Tea Stall

Viji's notebook has four columns. He has tried to take the average of each. Three of them gave him an answer; only one of those answers was meaningful. Four siblings turn up, climb a ladder, and explain why.
Vijayakumar P 12 min read
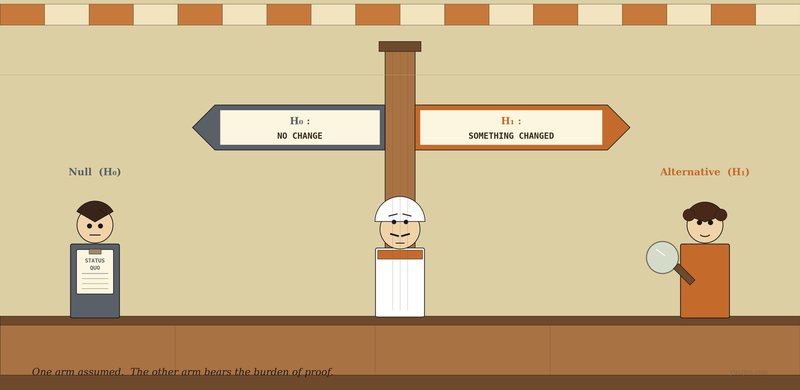
Stylised illustration of a tea stall — Viji stands centre behind his counter looking up at a wooden two-armed signpost mounted on the back wall. The left arm is grey, points left and reads `H₀ : NO CHANGE`. The right arm is warm orange, points right and reads `H₁ : SOMETHING CHANGED`. On the far left a calm man in plain grey holds up a small clipboard with `STATUS QUO` written across the top. On the far right a curly-haired man in warm orange holds up a magnifying glass.

Analytics

Null and Alternative Hypothesis Walk Into a Tea Stall

Viji started serving fresh ginger biscuits this month. His daily mean rose from 87 to 91. Real effect or noise? Two strangers explain why every test is a courtroom — and which side is presumed innocent.
Vijayakumar P 11 min read
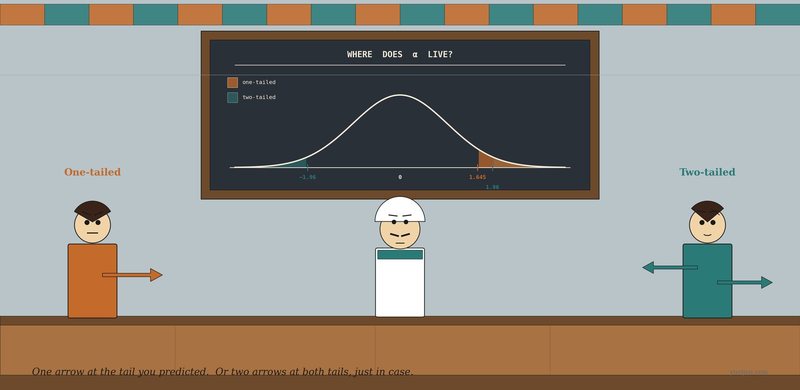
Stylised illustration of a tea stall — Viji stands centre behind his counter looking up at a long chalked bell-curve diagram on the back wall titled `WHERE DOES α LIVE?`. The curve has shaded rejection regions: a heavy orange shade on the right tail, lighter teal shading on both tails, with critical values −1.96, 1.645, 1.96 chalked along the baseline. On the far left a focused man in warm orange holds a single arrow pointing right toward the orange right tail. On the far right a calm man in teal holds two arrows pointing in opposite directions.

Analytics

One-tailed and Two-tailed Tests Walk Into a Tea Stall

Viji added cardamom to his tea. Mean rating rose from 3.8 to 4.0. He's about to run the t-test, and the software asks him a question he's never thought about — one-sided or two? Two strangers, one with a single arrow and one with two, explain why it matters.
Vijayakumar P 11 min read
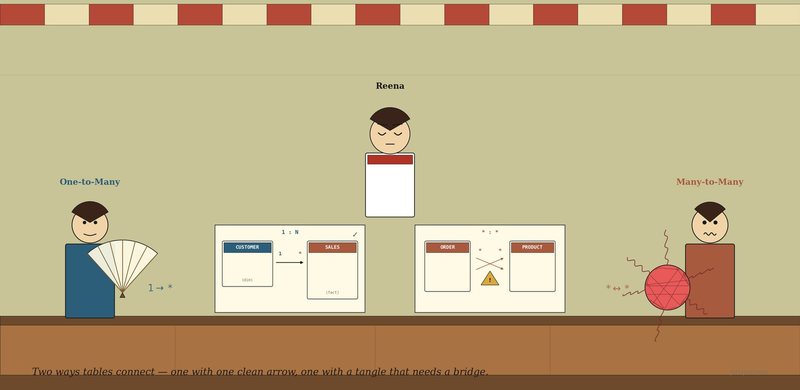
Stylised illustration of a tea stall — Reena standing behind her counter looking at two paper schemas in front of her: a clean Customer→Sales 1:N schema with a green tick, and a messy Order↔Product *:* schema with a yellow warning. A calm woman holding an open hand-fan approaches from the left, and a slightly flustered man holding a tangled red ball of yarn approaches from the right.

Analytics

One-to-Many and Many-to-Many Walk Into a Tea Stall

Reena's Power BI report has thrown a yellow warning at her. One stranger arrives with an open fan. The other arrives with a tangled ball of yarn — and a small wooden plank.
Rani C 9 min read
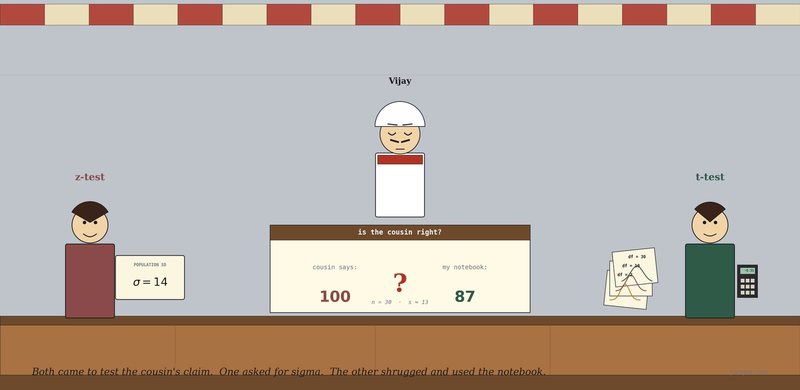
Stylised illustration of a tea stall — Viji stands behind his counter looking down at a paper card on the counter that asks 'is the cousin right?' with cousin's claim 100 on the left, his notebook's mean 87 on the right, and a big red question mark between them. A confident woman holding a printed σ = 14 card stands on the left; a careful man holding a fan of bell-curve cutouts and a small calculator showing −5.31 stands on the right.

Analytics

t-test and z-test Walk Into a Tea Stall

Viji's cousin keeps claiming he should average 100 customers a day. The notebook says 87. Two strangers turn up to test it — one needs to know sigma, the other doesn't.
Vijayakumar P 9 min read
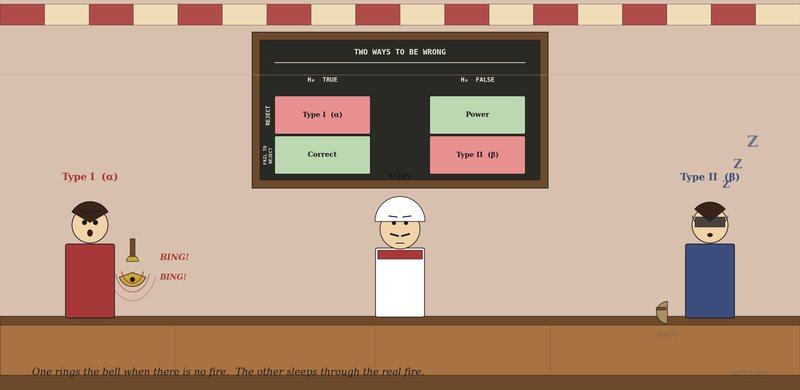
Stylised illustration of a tea stall — Viji stands centre behind his counter looking up at a chalkboard 2x2 matrix mounted high on the back wall labelled Type I (top-left, red), Power (top-right, green), Correct (bottom-left, green), Type II (bottom-right, red). On the far left a confident woman in red holds a handbell mid-ring with BING! BING! sound waves. On the far right a calm man in navy wears a sleep mask, snoring Zzz, his own bell silent at his side.

Analytics

Type I and Type II Errors Walk Into a Tea Stall

Viji's last 7 days dropped from his usual 87 to 75. The t-test rejects. Two strangers turn up — one rings a bell at every shadow, the other sleeps through real wolves — and explain what could go wrong with that verdict.
Vijayakumar P 10 min read
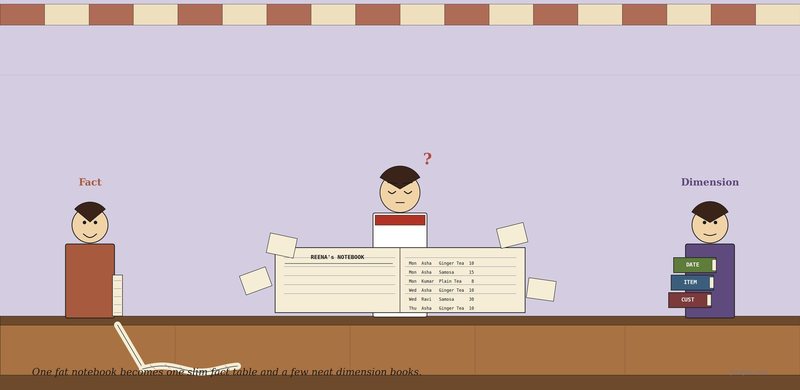
Stylised illustration of a tea stall scene — Reena stands behind her counter looking down at a thick open notebook with redundant rows and loose pages spilling out, a question mark over her head; a man with a long receipt scroll trailing down to the floor approaches from the left, a woman with a neat stack of three books labelled CUST, ITEM, DATE approaches from the right.

Analytics

Fact and Dimension Walk Into a Tea Stall

Reena's notebook is bursting with repetition. Her cousin wants the data organised the proper way before he comes on Sunday. Two strangers know exactly how to split it.
Rani C 7 min read
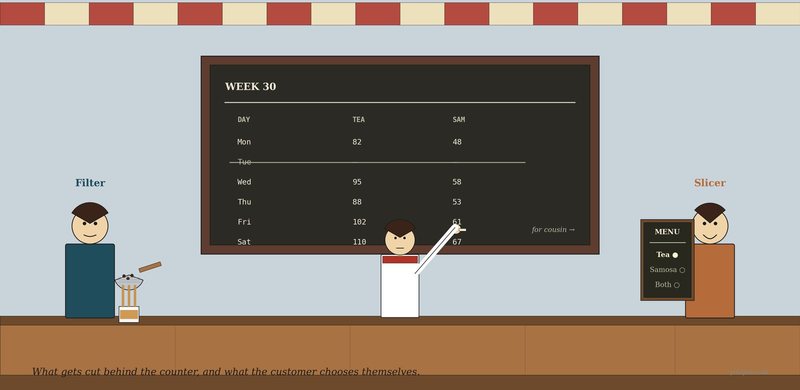
Stylised illustration of a tea stall scene — a wall-mounted chalk slate shows Reena's weekly tea and samosa numbers with Tuesday struck through; Reena is chalking on it; a woman with a tea strainer is approaching from the left and a man with a wooden menu board is approaching from the right.

Analytics

Slicer and Filter Walk Into a Tea Stall

Reena is preparing her slate for her cousin's visit. Some numbers should never be seen, some should be flipped through — and the difference is the difference between a filter and a slicer.
Rani C 6 min read
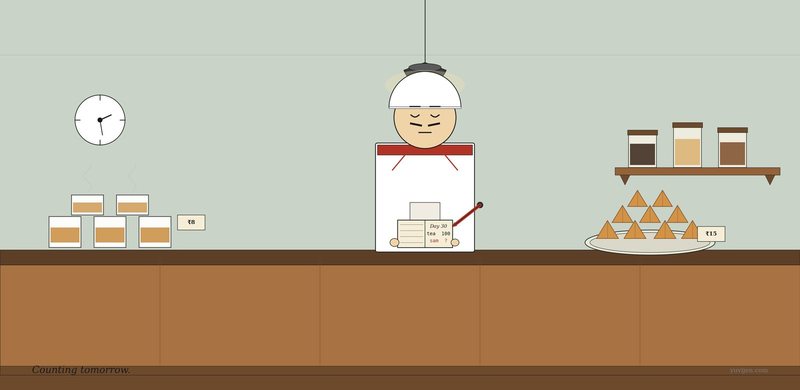
Stylised illustration of a tea stall owner standing behind his long wooden counter, holding an open notebook with a pen and quietly counting his inventory; a stack of tea glasses on the left of the counter, a plate piled with samosas on the right, a wall clock and a small jar shelf in the background.

Analytics

Correlation and Regression Walk Into the Same Tea Stall

Viji the tea stall owner needs to know how many samosas to fry tomorrow. Correlation can describe his data, Regression can predict from it — and the difference is the whole story.
Vijayakumar P 7 min read
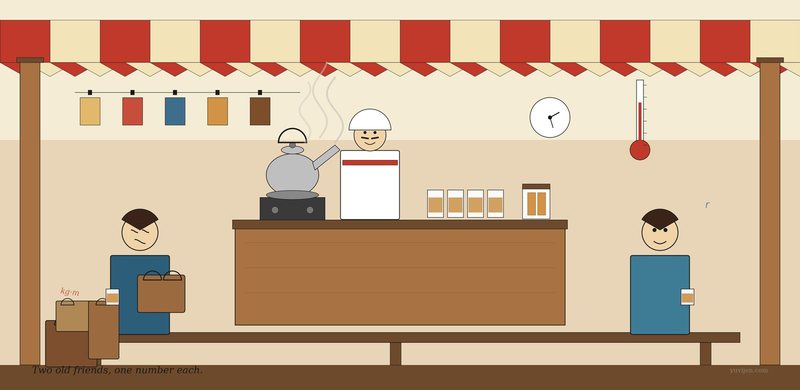
Stylised illustration of a roadside tea stall — two women on a long bench with cups of tea, one with shopping bags piled around her, the other calm and empty-handed; the tea stall owner pouring tea behind the counter.

Analytics

Covariance and Correlation Walk Into a Tea Stall

Viji the tea stall owner has a question. Two old friends arrive with two different answers — same idea wearing different clothes.

Vijayakumar P 5 min read

Stay in the loop

Follow Yuvijen on LinkedIn.

New posts, research notes, and analytics tips — straight to your LinkedIn feed.

Follow on LinkedIn

linkedin.com/company/yuvijen · no signup needed