Analytics
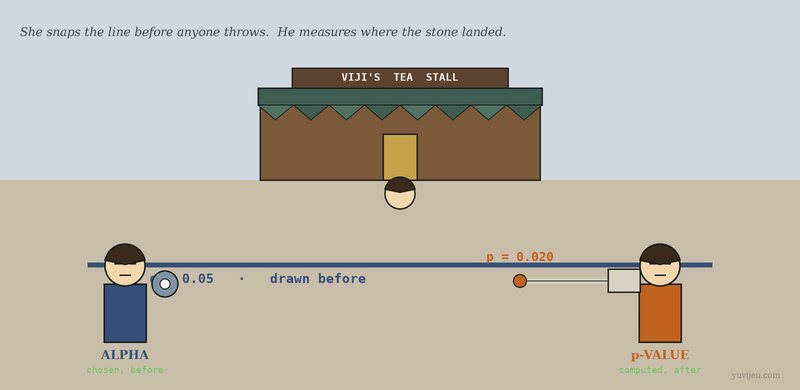
p-value and Alpha Walk Into a Tea Stall
Viji's new kettle looks like it sold 8 more cups a day, and the test returns p = 0.020. His cousin asks what would have happened if he had wanted α = 0.01 instead. Two strangers explain why that question has to be answered before the data arrives, not after.
Analytics
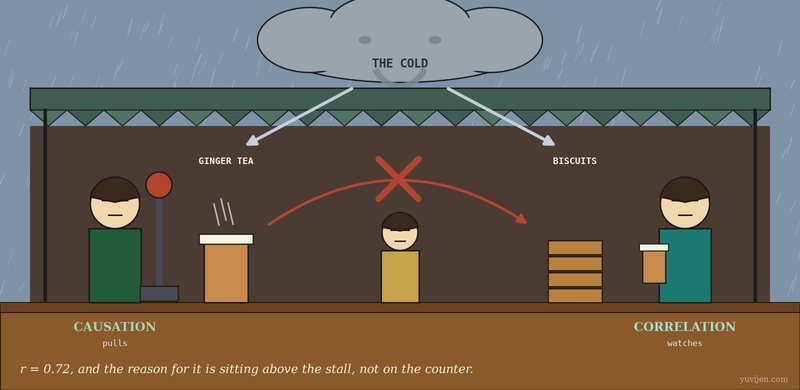
Correlation and Causation Walk Into a Tea Stall
Ginger tea and biscuits rise and fall together, r = 0.72, and Viji is about to discount ginger tea to sell more biscuits. Correlation is back, a man with a lever walks in behind her, and the person who explains everything has been sitting in the corner the whole time.
Analytics
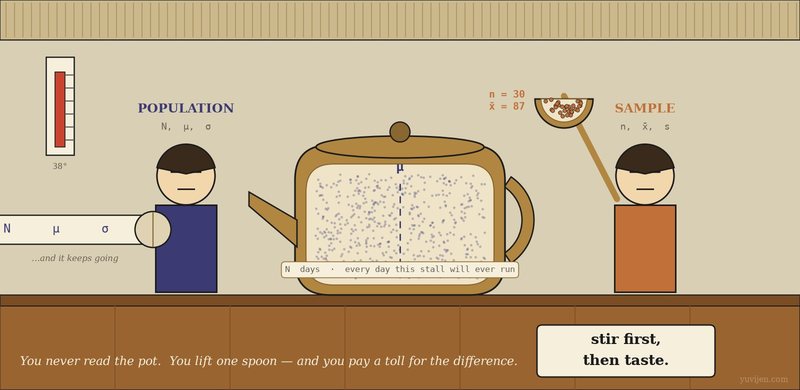
Population and Sample Walk Into a Tea Stall
Viji's notebook says the average is 87 customers a day. His cousin says that is the average of his notebook, not of his stall. Two strangers — one with a scroll that never fully unrolls, one with a brass ladle — explain the difference, and what it costs.
Analytics
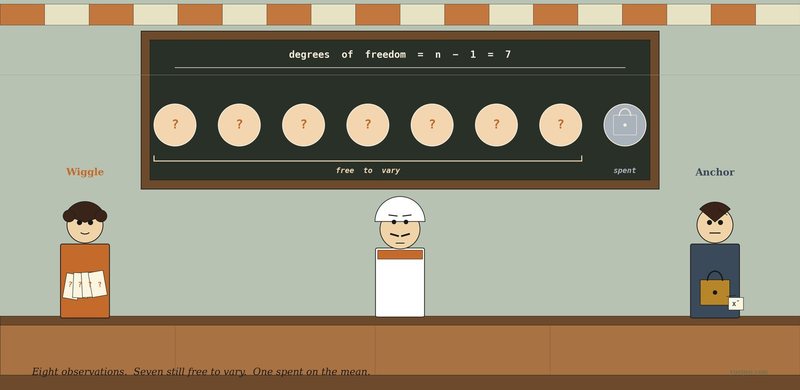
Degrees of Freedom Walks Into a Tea Stall
Viji's calculator keeps using n − 1 instead of n. He doesn't know why. Two strangers — one with a fan of blank slips, one with a brass padlock — explain why every parameter you estimate costs you one of your data points.
Analytics
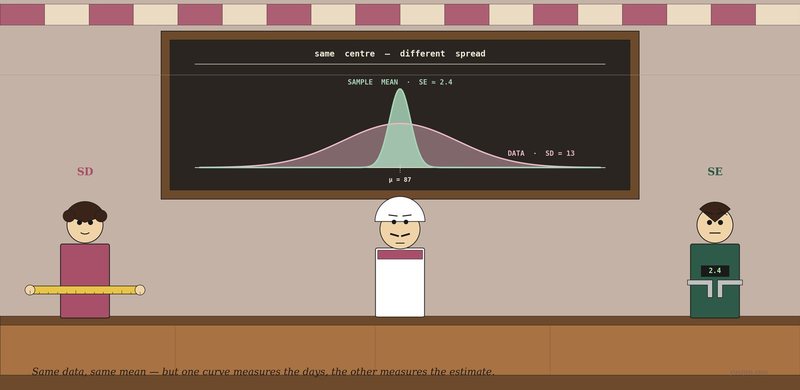
Standard Deviation and Standard Error Walk Into a Tea Stall
Viji's cousin asks how confident he is about the 87-customer average. Viji says "SD = 13". The cousin says "wrong number, brother." Two strangers — one with a measuring tape, one with a precision caliper — explain why.
Analytics
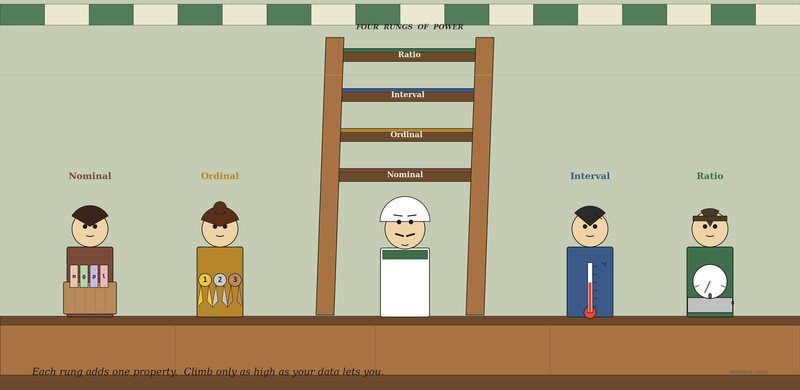
Nominal, Ordinal, Interval, Ratio Walk Into a Tea Stall
Viji's notebook has four columns. He has tried to take the average of each. Three of them gave him an answer; only one of those answers was meaningful. Four siblings turn up, climb a ladder, and explain why.
Analytics
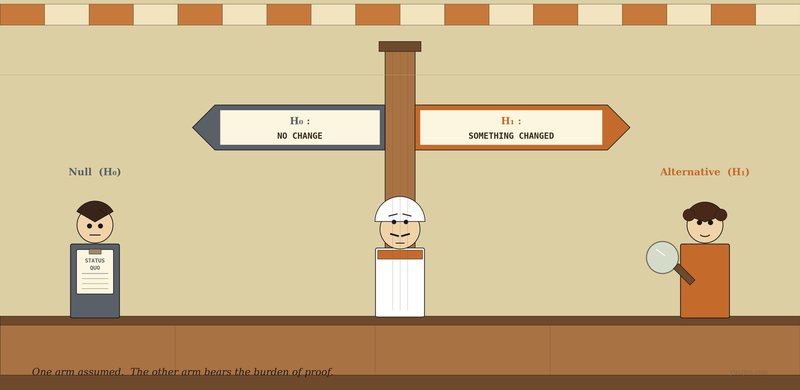
Null and Alternative Hypothesis Walk Into a Tea Stall
Viji started serving fresh ginger biscuits this month. His daily mean rose from 87 to 91. Real effect or noise? Two strangers explain why every test is a courtroom — and which side is presumed innocent.
Analytics
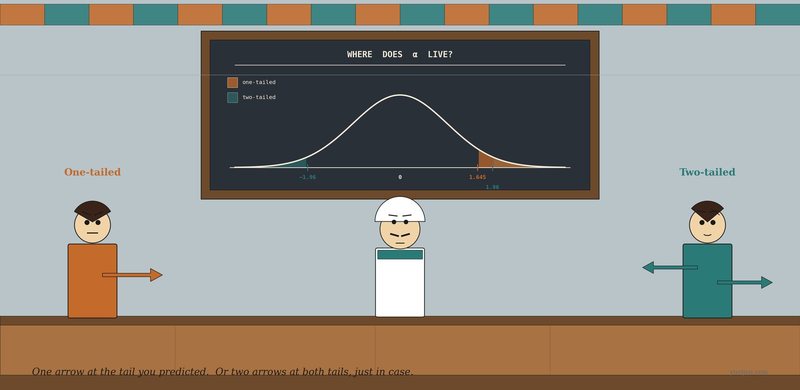
One-tailed and Two-tailed Tests Walk Into a Tea Stall
Viji added cardamom to his tea. Mean rating rose from 3.8 to 4.0. He's about to run the t-test, and the software asks him a question he's never thought about — one-sided or two? Two strangers, one with a single arrow and one with two, explain why it matters.
Analytics
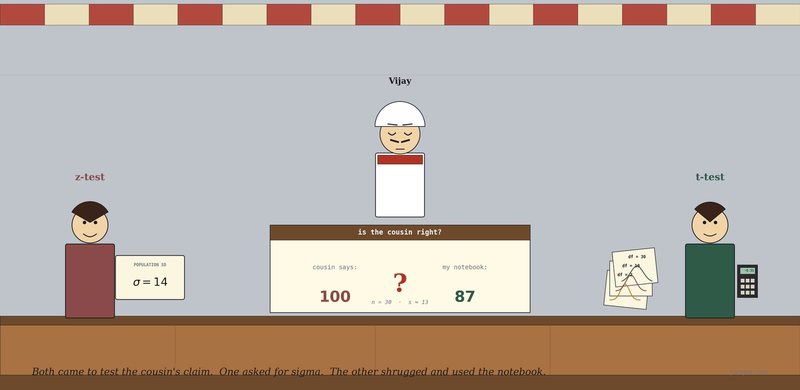
t-test and z-test Walk Into a Tea Stall
Viji's cousin keeps claiming he should average 100 customers a day. The notebook says 87. Two strangers turn up to test it — one needs to know sigma, the other doesn't.
Analytics
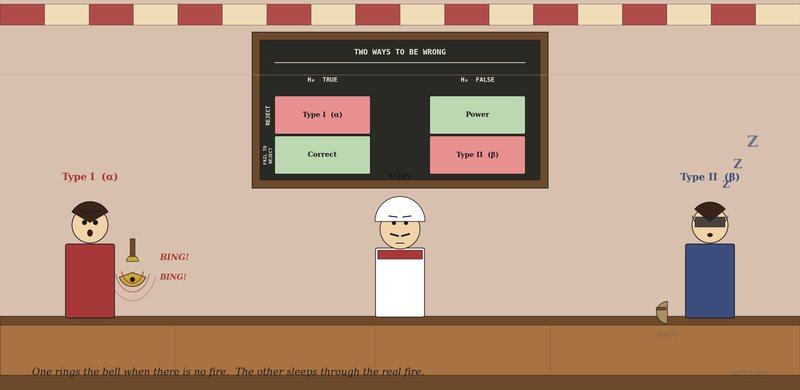
Type I and Type II Errors Walk Into a Tea Stall
Viji's last 7 days dropped from his usual 87 to 75. The t-test rejects. Two strangers turn up — one rings a bell at every shadow, the other sleeps through real wolves — and explain what could go wrong with that verdict.
Analytics
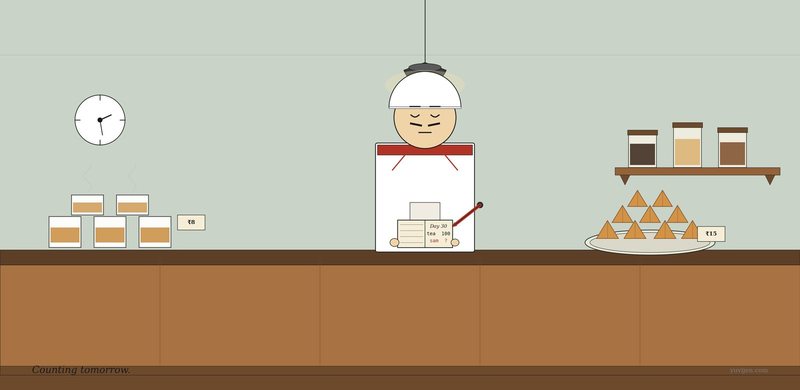
Correlation and Regression Walk Into the Same Tea Stall
Viji the tea stall owner needs to know how many samosas to fry tomorrow. Correlation can describe his data, Regression can predict from it — and the difference is the whole story.
Analytics
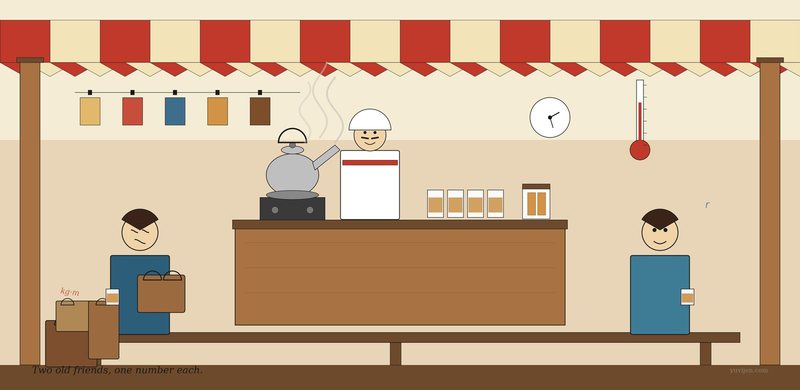
Covariance and Correlation Walk Into a Tea Stall
Viji the tea stall owner has a question. Two old friends arrive with two different answers — same idea wearing different clothes.
Stay in the loop
Follow Yuvijen on LinkedIn.
New posts, research notes, and analytics tips — straight to your LinkedIn feed.
Follow on LinkedInlinkedin.com/company/yuvijen · no signup needed