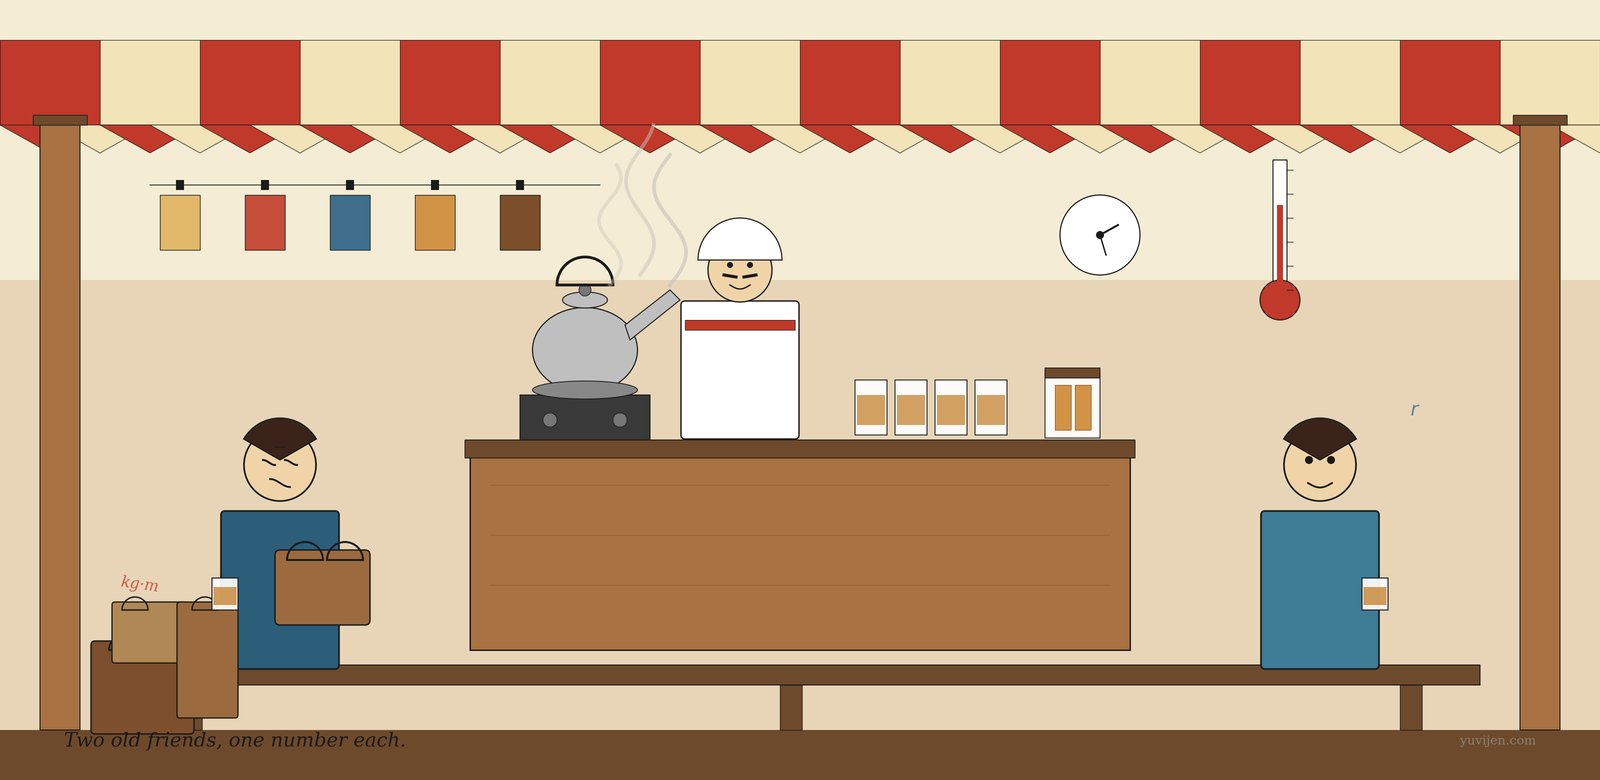
It’s a hot afternoon. The kettle hisses. The ceiling fan turns slowly above. Vijay, who owns the tea stall on the corner, has been keeping a small notebook under the counter for thirty days. Each line: today’s temperature, today’s tea sales. His cousin had told him — brother, just count, you’ll see — hotter days mean more business — and now Vijay is wondering if it’s true. (His cousin has many theories. Last month, it was that the moon affects sweet sales.) If it is true, he is thinking about opening a second stall.
His two regulars — Covariance and Correlation, old friends, both women — step in under the awning. Covariance is looking flustered, with a small mountain of overstuffed cloth bags slung over her shoulder. Correlation is calm, clear-eyed, holding only a glass of tea.
Vijay slides the notebook across the counter and says, “Tell me. Hotter days, more tea? My cousin says yes. I want a number.”
Covariance tries first
Covariance pulls the notebook close. She mutters. She scribbles on a corner of newspaper. She frowns. She scribbles again. After a few minutes she announces:
“47.6.”
Vijay squints and asks, “47.6 what?”
She says, “Rupee-degree-Celsius.”
A long pause. The fan ticks.
Vijay asks, “Is that… a lot?”
Covariance shrugs a flustered shrug and says, “It is positive. So they move together. Hot day, more tea. Your cousin is right about the direction.”
Vijay asks, “But is it strong?”
She hesitates and says, “Hmm. Let me try different units.” She switches the notebook to °F and paise, recomputes, and — as if to prove her point — a fresh cloth bag appears on her shoulder. She announces:
“8,568.”
Vijay looks horrified and says, “Same notebook! Same Tuesday! Same customers!”
Covariance is starting to sweat under her bags. She says, “Same data. Different rulers. The units travel with me. I cannot help it. They have been with me since school.”
Correlation tries
Vijay turns to Correlation, who has been sipping the whole time. He says, “Your friend is making my head spin.”
Correlation smiles, sets her glass down, and reaches for the newspaper. She does Covariance’s calculation, then divides by two more numbers — the spread (standard deviation) of the temperatures and the spread (SD) of the sales, she says, fancy words for how scattered the numbers are. The units cancel out as cleanly as wiping chalk off a slate.
She writes: “0.18.”
Vijay leans in and asks, “And what does that mean?”
She says, “A tight relationship would be near +1. A strong opposite would be near −1. Nothing going on at all would be near 0.”
Vijay asks, ”…And mine is 0.18?”
She says, “Barely a whisper, Vijay. Two strangers waiting at the same bus stop would correlate harder.”
He turns to Covariance, who is slowly setting down her bags, and asks, “So my cousin… is wrong?”
Correlation says gently, “Your cousin saw a hot afternoon and a busy stall on the same day and thought one explained the other. The notebook does not agree. The relationship is so weak that you would be a fool to open a second stall on its strength.”
What just happened
Vijay pours himself a glass of tea for the first time all day, sits down on his own counter, and asks, “But why does her number change so much when she just changes the units?”
Correlation says, “Because covariance is honest about the direction — sign matters — but the size it gives you depends on what ruler you used. It is like telling someone you are one point seven somethings tall. One point seven metres? One point seven centimetres? Useless until you say.”
Vijay asks, “And yours doesn’t change?”
She says, “Mine is just a number. Same in metres or paise or dragon-units. That is its whole job.”
Covariance raises her glass tiredly and says, “Sorry.”
Then she sets the glass down, raises one finger, and adds, “I want to say one thing in my defence. I am not useless overall. Big-name statistics still calls me first — PCA, factor analysis, portfolio risk — anywhere variance has to do real work. I just do not do well at tea stalls.”
Correlation pats her shoulder and says, “She is right. Without her, half of multivariate statistics would collapse. Today is just not her day.”
The same chat, in a chart
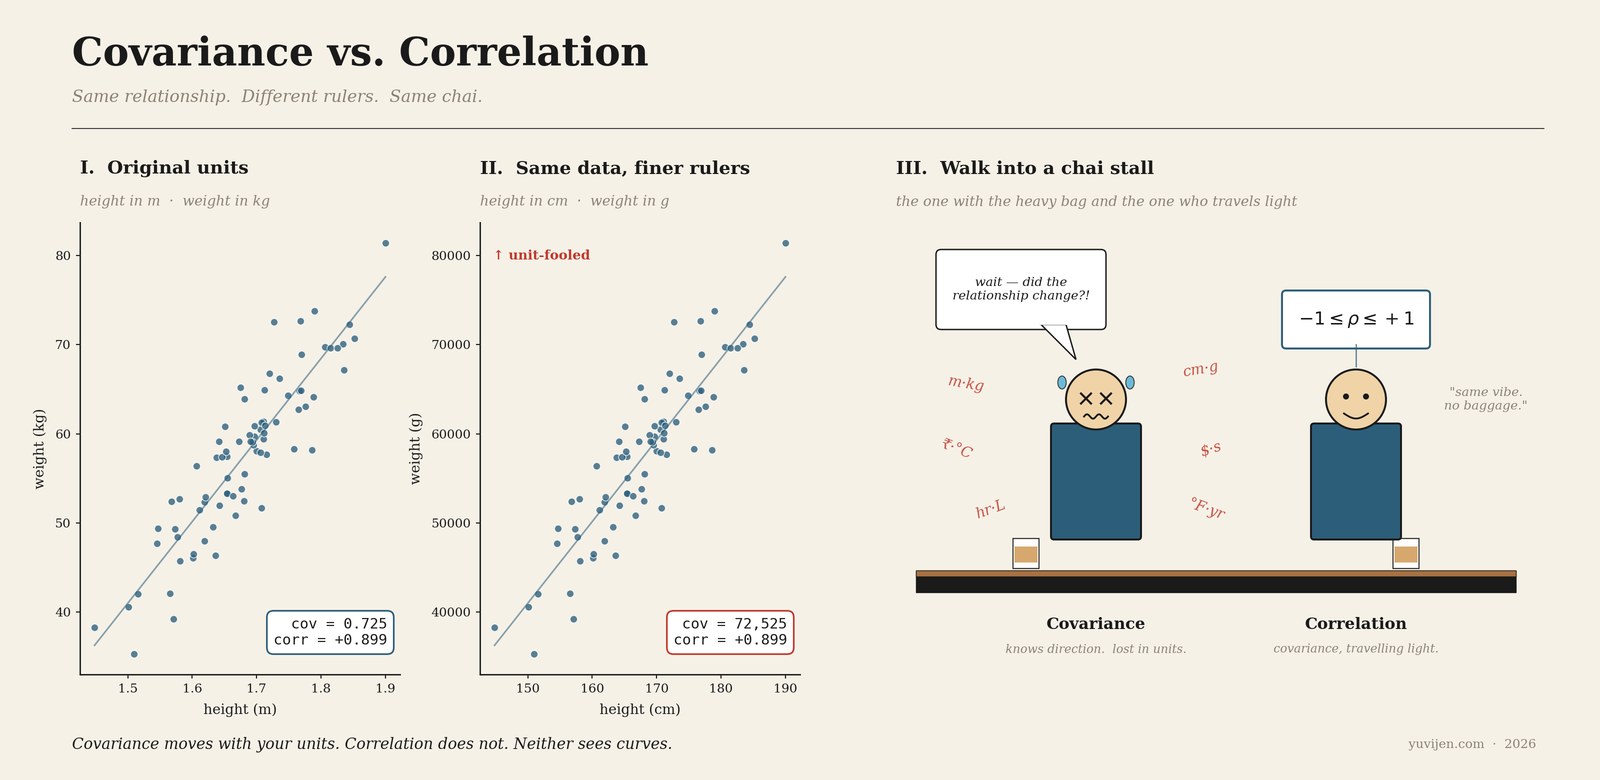
That picture is exactly the same conversation, drawn. Same scatter on both sides. The covariance shoots up by a factor of about 180 when the units change from °C·rupees to °F·paise. The correlation does not move a millimetre.
One last warning before she leaves
Correlation finishes her tea and stands up. She says, “One more thing, Vijay. Don’t take 0.18 to mean nothing is happening at all. It means no straight-line pattern. Two things can be deeply related and still give a number near zero — if the relationship is curvy. Hours since lunch, plotted against how grumpy a person is. Calm right after lunch, hangry by 4 p.m. — a clean little U-shape. Both Covariance and I would shrug and say zero. We are blind to curves.”
Vijay nods slowly and says, “So plot first.”
She says, “Plot first. Then the number.”
Quick gut-check
You change your sales data from rupees to paise. What happens to the covariance? To the correlation?
Covariance multiplies by 100. Correlation rolls its eyes and stays exactly where it was.
The bill
Vijay closed his notebook with a small smile. The expansion plan was off. He poured another glass and went back behind the counter. The fan ticked. The kettle hissed. The two friends finished their tea in silence. Somewhere, his cousin was probably preparing a new theory.
Use both. Just never quote covariance like it is correlation. That is how people end up planning second stalls based on units they did not notice.
For the math-curious
Cov(X, Y) = average of (X − X̄)(Y − Ȳ)
Corr(X, Y) = Cov(X, Y) ÷ (σ_X · σ_Y)
Same idea. Different clothes.